One of the most pressing challenges facing society, globally, is how to meet the growing demand for food, in the face of climate change, while sustaining ecosystem services. For a 21st-century sustainable food system to emerge, new harmonized data and network-level spatio-temporal analytical approaches across food value chains are needed.
This project will, first, develop novel spatial data mining approaches to reduce computational challenges associated with characterizing and predicting sustainability benefits and burdens across highly heterogeneous landscapes and management practices of U.S. corn-soy and Central American sugar production systems. Second, we will characterize the interconnectedness of domestic and global supply networks by linking sub-national production sustainability indicators to intermediate and end-use consumption of these high-impact commodities in food systems.
Leveraging the engagement of key practitioner partners, results will inform public policy and commodity certifications, commodity sourcing architecture of complex food systems, and incentives influencing dietary choices.
An urban area consumes a lot of meat. Meat has a high environmental impact because of a large amount of corn feed. There is a lack of information where corn and livestock for a given urban area come from. Our Food System Supply-Chain Sustainability (FoodS3) model enables us to see the corn traveling through the farm-to-feed-to-food pipeline in the U.S.
The map below highlights connection between where corn and livestock are produced and where they are consumed, as measured in bushels of embedded corn. In this study, the animal feed includes corn and DDGS (Distiller's dried grains with solubles).
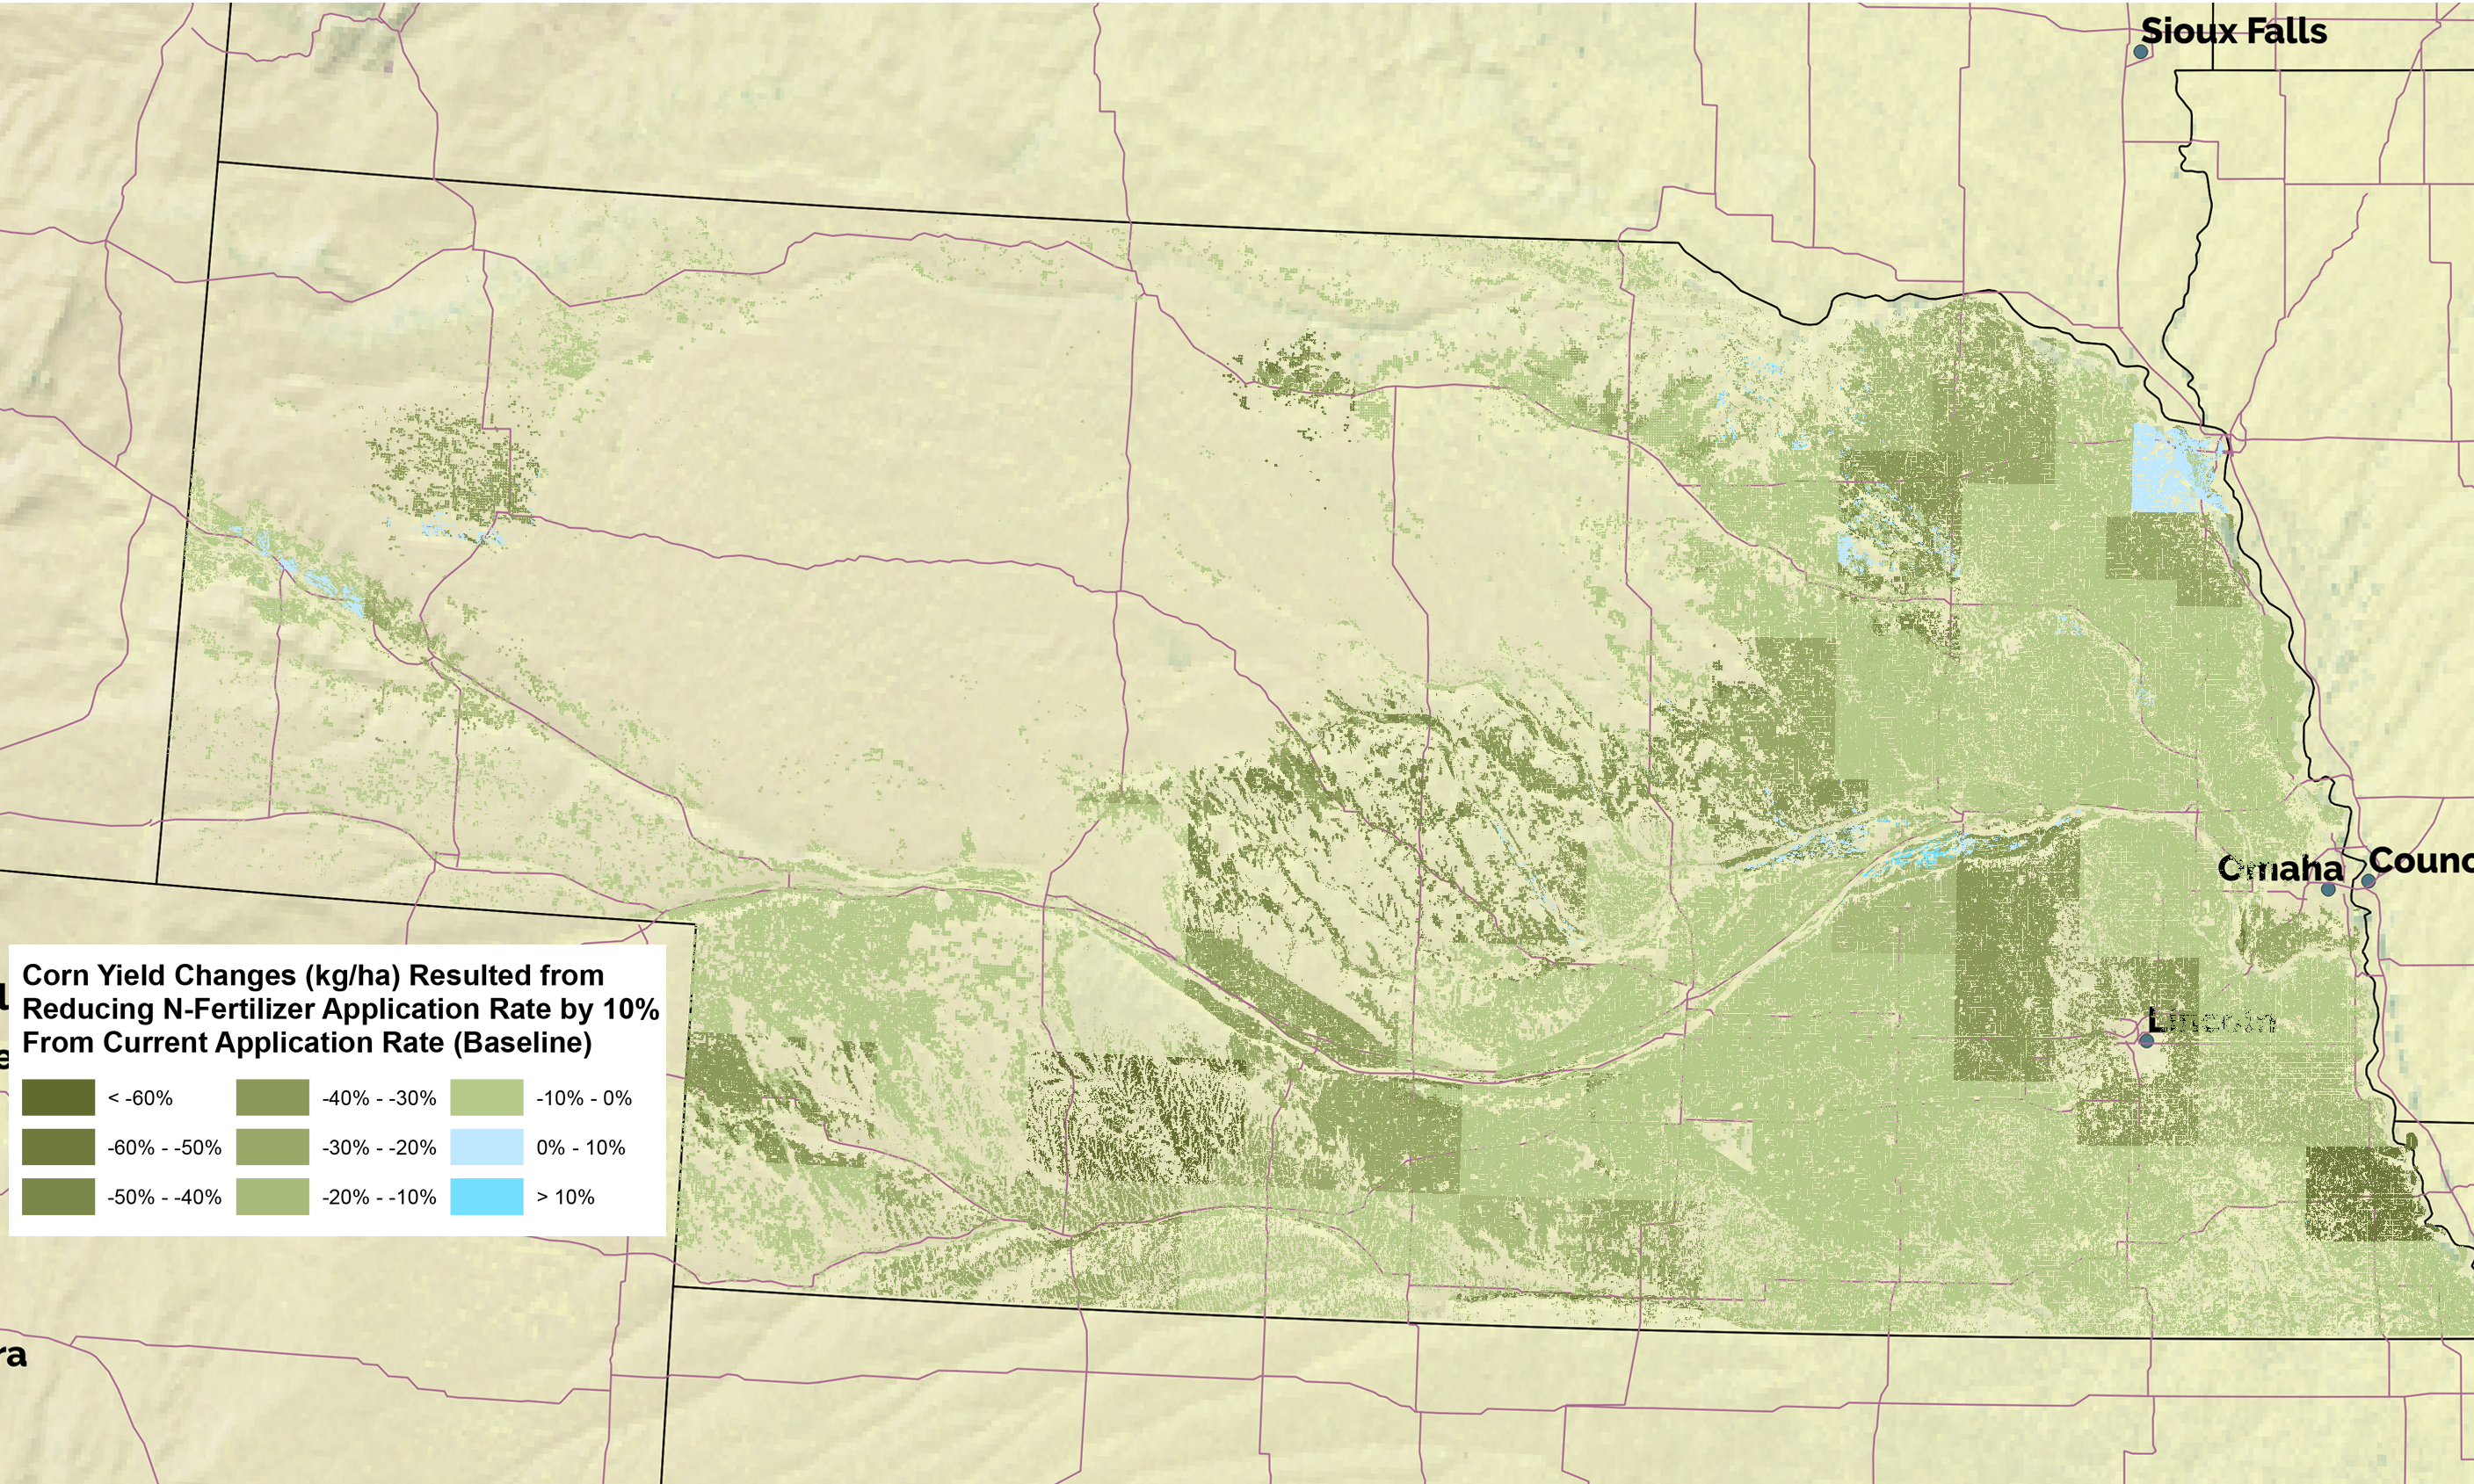
These visuals display the impacts of reducing N-fertilizer application on Nebraska corn fields. Tap the buttons below to see the changes to corn yield and global warming potential based on the amount of reduction.
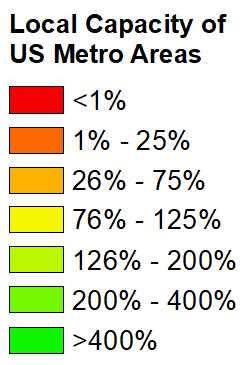
In many parts of the country, local production of basic food staples isn't enough to feed the local population. Local Capacity, or the maximum amount of the local consumption that can be satisfied by local production, is shown here as a percentage for all major US metropolitan areas. Local Capacity estimates inform local level policymakers, serves as a baseline for supply chain estimates, and quantify the degree which urban areas are dependent on rural areas for food production.
Red metro areas are not self-sufficient in a specific food - that is they do not produce enough of the target food locally to satisfy household demand of that food. Green metro areas are self-sufficient - producing more than enough to satisfy local household consumption. Observe the impact of the increasing the definition of local on how many metro areas are self-sufficient.
"MSA" is the Metropolitan Statistical Area